

Increase in total orders
Increase in new customers
Increase in Products Sold
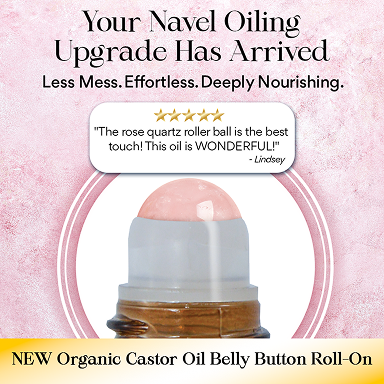
Queen of the Thrones is a health and wellness brand that specializes in castor oil and wellness enrichment. Their core desire is to educate consumers on the benefits of castor oil, and how it can replace over 20 skincare or health products in one.
When first joining BAD, Queen of the Thrones was struggling to convey the benefits of their castor oil in an educational but engaging way. They had no affiliate presence on TikTok Shop, and no content native to the platform.
Before we were able to start scaling Queen of the Thrones, we had to fully optimize their existing TikTok shop listings, and sourcing creators who would match their target audience and messaging. The brand had some hesitation about initial creators, and we agreed to test out their selected creators to start. During this first period, we saw a 243% increase in GMV, and a 225% increase in orders, demonstrating rapid early-stage growth and increased sales consistency through optimized organic content and platform execution.
After our initial launch the client wanted to continue testing out the influencers they selected to represent their brand. Initial data showed that these creators were not presenting the product or the brand in an engaging way, and were not supporting brand growth. While some initial sales were rolling in, the BAD team emphasized to the client that a shift in content strategy was a must. The initial creator testing generated: 52.29% increase in GMV28.57% Increase in Orders50.00% Increase in Products Sold
After several weeks of mediocre performance, the client finally agreed to let BAD test our creator strategy and shift focus from stabilization to intentional scale. We established data-driven content systems and consistent posting from our chosen creators to drive higher purchase volume. We doubled down on top-performing formats, stronger calls to action, and optimized product positioning to accelerate conversion and order velocity. This optimized strategy led to exponential growth in a period of weeks, rather than months. The revised content strategy led to:
The Optimized Content Strategy Led To:
1,444.99%
Increase in GMV
2,416.67%
Increase in orders
2,214.29%
Increase in products sold

As sales continued flooding in, we shifted our focus to sustaining high-volume performance and operational consistency at scale. We established upgraded content systems, affiliate momentum, and optimized conversion flows which enabled the account to handle significantly increased traffic and order volume without regression. This period highlighted our shift into full commercial maturity, with predictable daily revenue, strong customer acquisition and platform-level momentum.
Through July our BAD Process Generated an Additional:
887.56%
Increase in GMV
901.01%
Increase in orders
882.53%
Increase in products sold

Before BAD Marketing
$143.35
Total TikTok Revenue
<10
Total orders placed
<10
Total items sold
After BAD Marketing
$258,507.28
Total TikTok Revenue
238,040%
Increase in Orders Placed
249,660%
Increase in Products Sold

Manage your consent for each category below. Disabling some cookies may affect your experience.